Depletion/Injection Settings view
This view displays the results of the depletion/injection calculation. The two main tracks of interest in this view show the results in normal and EMW references. The first image shows a 1MPa depletion in Formation E. The next image shows a two-step depletion/injection process. Note that the log names indicate which process has been used in the calculation (i.e. Horizontal Stress, Maximum, depleted-injected (PPP Case).
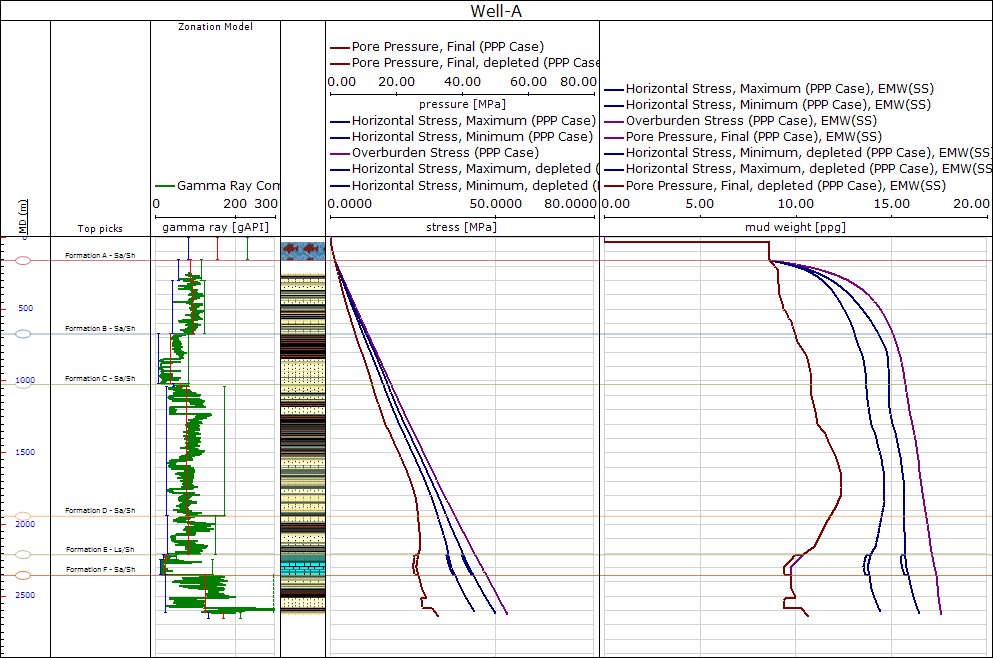
1MPa depletion in Formation E click to enlarge
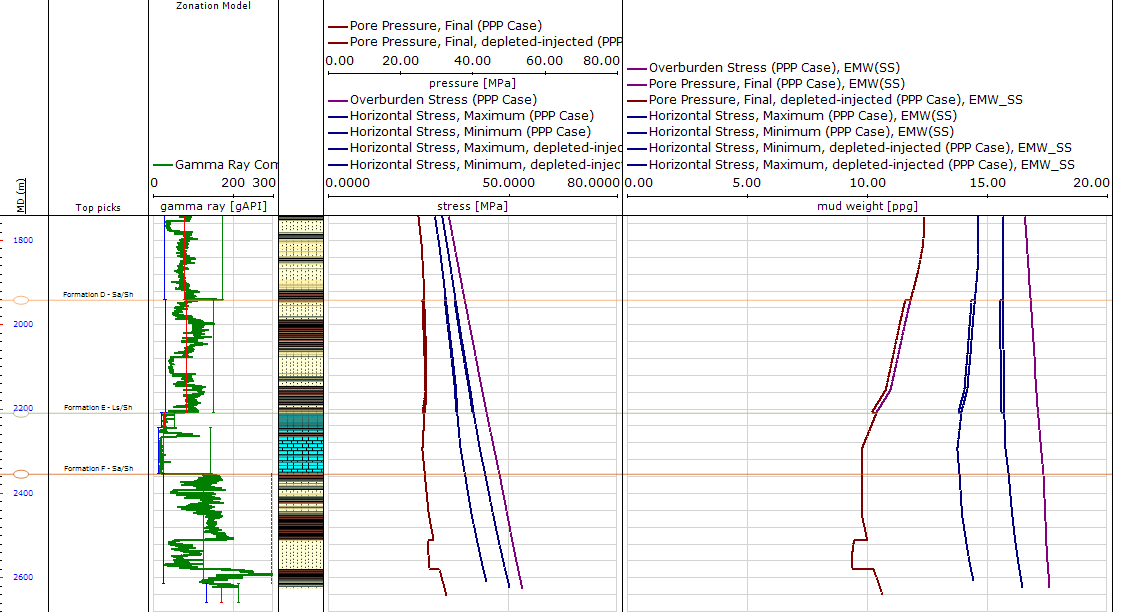
A two-step depletion/injection process click to enlarge
For more information, see Calculating the effect of depletion and injection.